- 您现在的位置:买卖IC网 > Sheet目录503 > R6015ANX (Rohm Semiconductor)MOSFET N-CH 600V 15A TO-220FM
R6015ANX
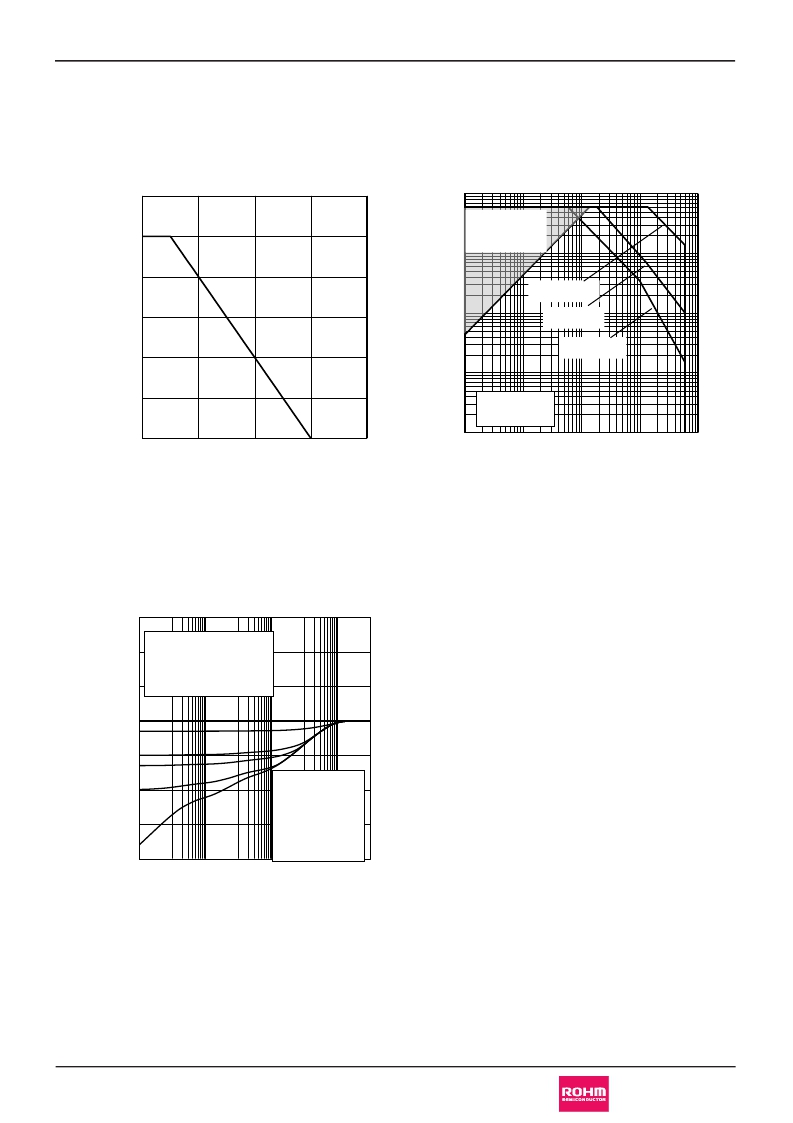
? Electrical characteristic curves
Fig.1 Power Dissipation Derating Curve
120
Data Sheet
Fig.2 Maximum Safe Operating Area
100
Operation in this
100
10
area is limited
by R DS(ON)
80
P W = 100us
60
40
20
1
0.1
P W = 1ms
P W = 10ms
T a = 25oC
Single Pulse
0
0
50
100
150
200
0.01
0.1
1
10
100
1000
Junction Temperature : Tj [ ° C]
Fig.3 Normalized Transient Thermal
Resistance vs. Pulse Width
1000
Drain - Source Voltage : V DS [V]
100
10
1
0.1
0.01
0.001
0.0001
T a = 25oC
Single Pulse
R th(ch-a)(t) = r (t) × R th(ch-a)
R th(ch-a) = 70oC/W
top D = 1
D = 0.5
D = 0.1
D = 0.05
D = 0.01
D = Single
0.0001
0.01
1
100
Pulse Width : PW [s]
www.rohm.com
? 2012 ROHM Co., Ltd. All rights reserved.
5/13
2012.02 - Rev.B
发布紧急采购,3分钟左右您将得到回复。
相关PDF资料
R6020ANX
MOSFET N-CH 600V 20A TO-220FM
R8002ANX
MOSFET N-CH 800V 2A TO-220FM
R8008ANX
MOSFET N-CH 800V 8A TO-220FM
RCD040N25TL
MOSFET N-CH 250V 4A SOT-428
RCD080N25TL
MOSFET N-CH 250V 8A SOT-428
RCR-ML-010HT-3
MODULE RCVR REMOTE CTRL HOLTEK
RCX120N25
MOSFET N-CH 250V 12A TO-220FM
RCX330N25
MOSFET N-CH 250V 33A TO-220FM
相关代理商/技术参数
R6015ANX_12
制造商:ROHM 制造商全称:Rohm 功能描述:Nch 600V 15A Power MOSFET
R6015ANZ
制造商:ROHM 制造商全称:Rohm 功能描述:10V Drive Nch MOSFET
R6015FNX
功能描述:MOSFET Trans MOSFET N-CH 600V 15A
RoHS:否 制造商:STMicroelectronics 晶体管极性:N-Channel 汲极/源极击穿电压:650 V 闸/源击穿电压:25 V 漏极连续电流:130 A 电阻汲极/源极 RDS(导通):0.014 Ohms 配置:Single 最大工作温度: 安装风格:Through Hole 封装 / 箱体:Max247 封装:Tube
R6018ANJ
制造商:ROHM 制造商全称:Rohm 功能描述:10V Drive Nch MOSFET
R6018ANJTL
制造商:ROHM Semiconductor 功能描述:10V DRIVE NCH MOSFET T/R - Tape and Reel 制造商:ROHM Semiconductor 功能描述:MOSFET N-CH 10V DRIVE LPTS
R6018ANX
制造商:ROHM 制造商全称:Rohm 功能描述:Nch 600V 18A Power MOSFET
R6018ANX_12
制造商:ROHM 制造商全称:Rohm 功能描述:Nch 600V 18A Power MOSFET
R601N4100J
制造商:ARCO 功能描述:RF510X250 22.5MM L/S
